Fiscal Atlas
See where federal money comes from and where it goes
Taxes in, spending out, who is enrolled, which places pay and which receive, and what is paid in error. Data pages built on official U.S. government data, with the source beside every chart, plus a page for each major benefit program, a planning lab and a methods page.
Free in your browser. Nothing you type leaves this page.
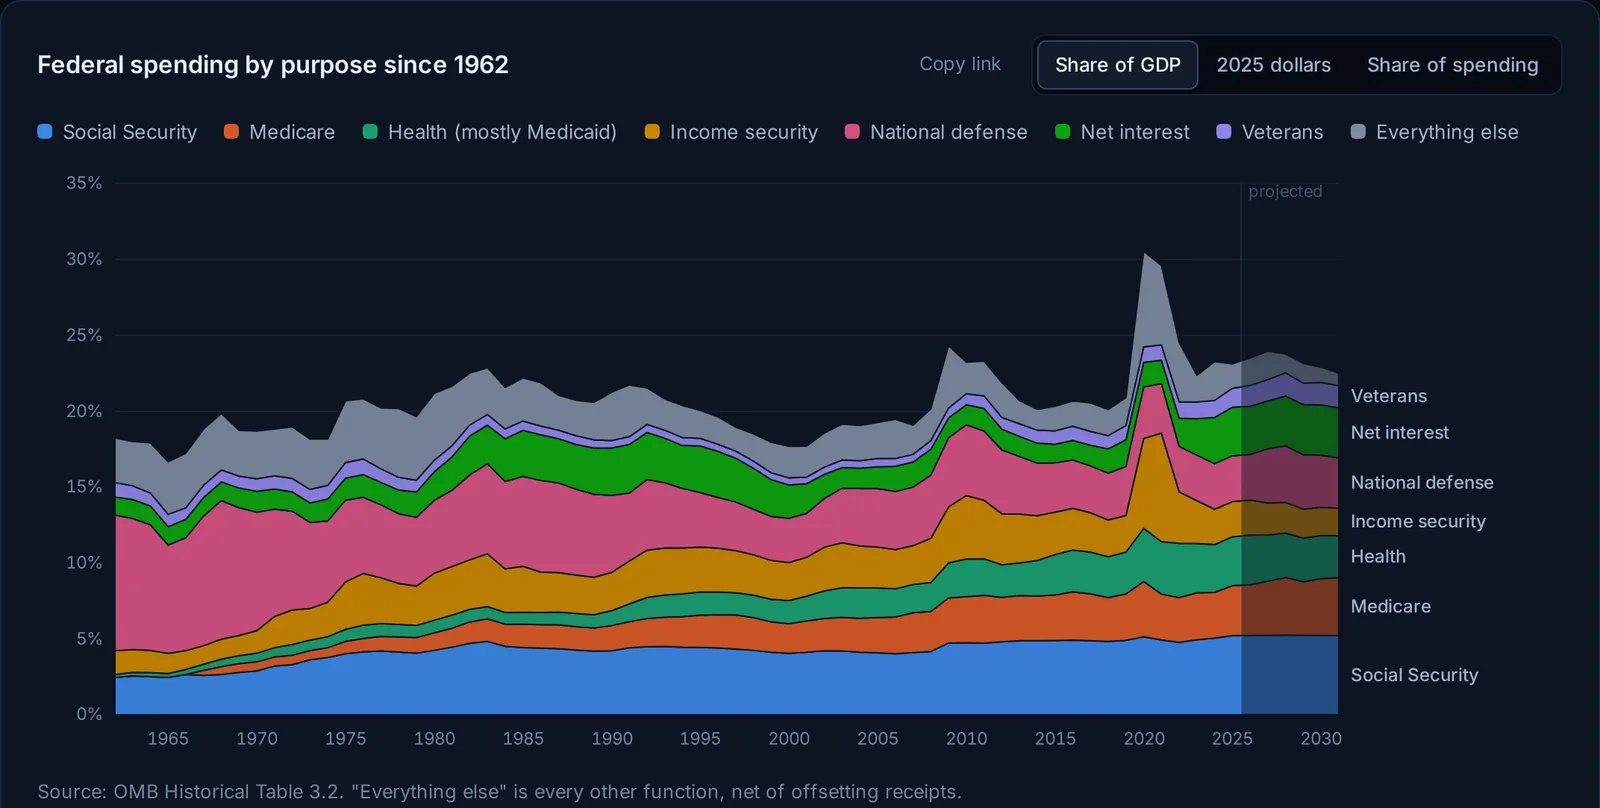
Follow the money from taxes to spending
Receipts and spending since 1940, as dollars or as a share of the economy. Who funds the government, where each dollar goes, which agencies spend it, and how much is borrowed to cover the gap.
Each chart has the numbers behind it in a table you can download.
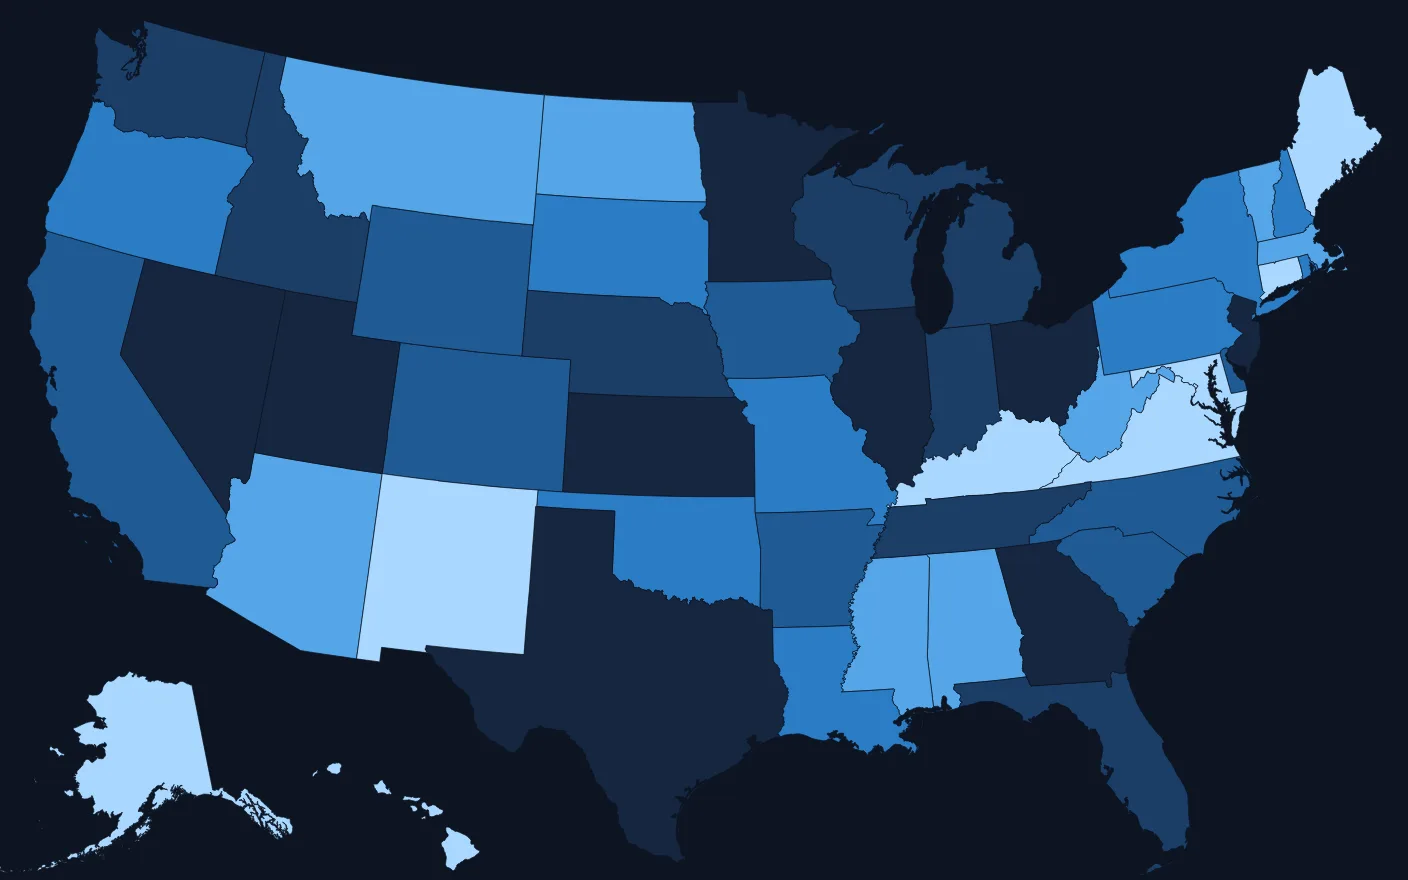
See your state and county
Maps of federal income tax paid and federal dollars received for every state, and of Social Security, disability, veterans compensation and Medicare for more than 3,100 counties.
The page says what each map can and cannot show. Income tax is about half of federal revenue, so the comparison is between places, not a full ledger.
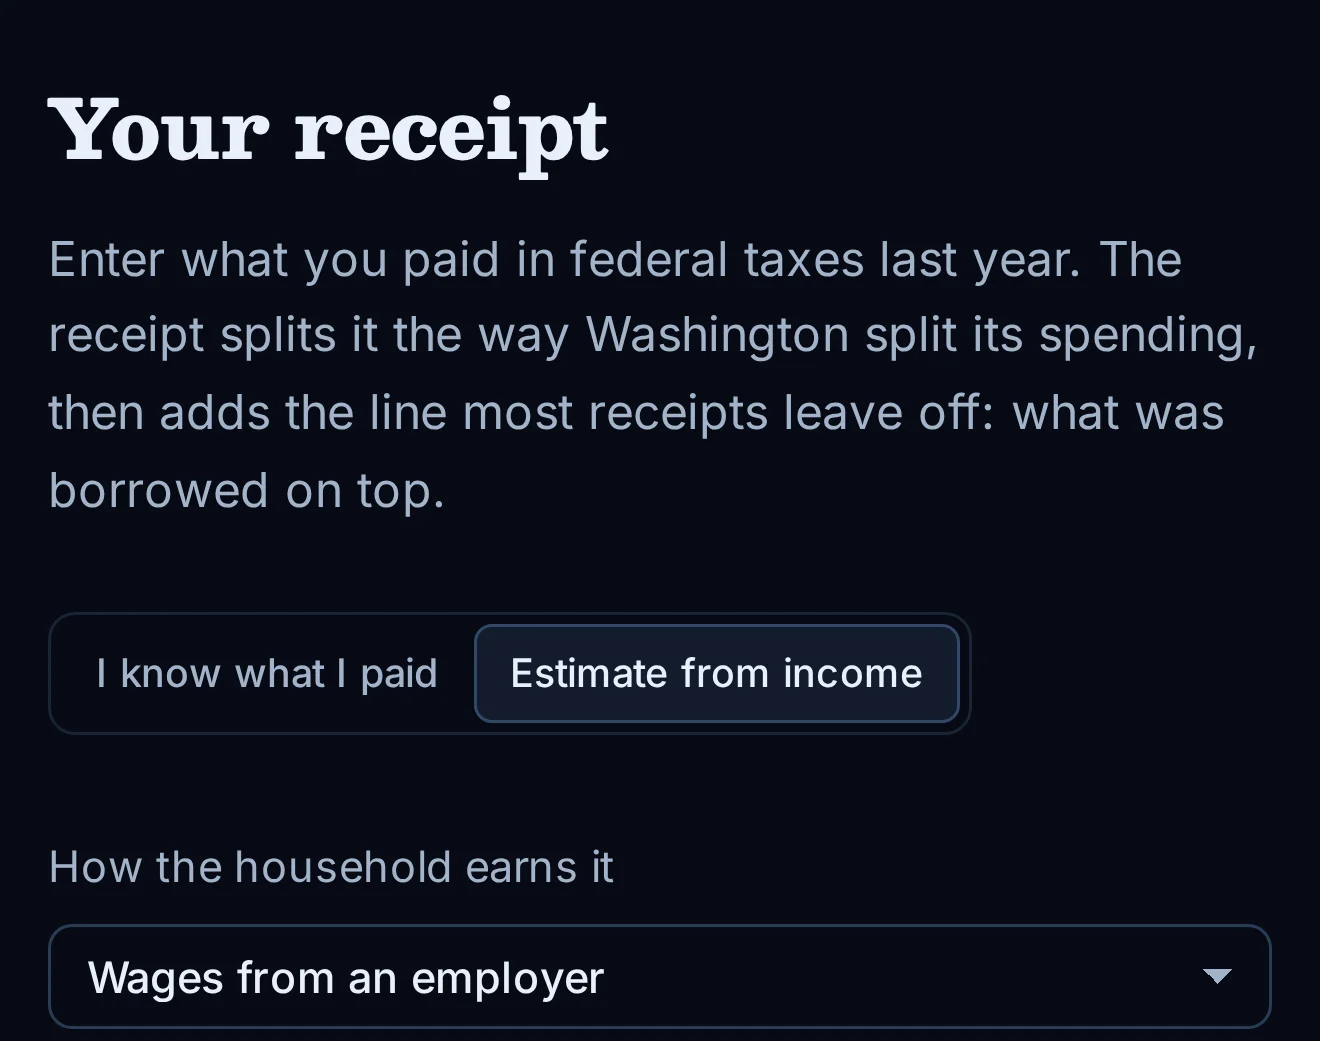
Get a receipt for your taxes
Enter what you paid. The receipt splits it the way Washington split its spending, then adds the line most receipts leave off: what was borrowed on top of every tax dollar.
Errors, fraud and policy are three different things
Arguments about waste usually blur them. Fiscal Atlas keeps them apart and shows what the data can and cannot say about each.
- Paid in errorWhat agencies themselves report as improper payments, by program, in dollars and as an error rate.
- StolenThe Government Accountability Office's range for fraud losses, with its own caveats.
- Working as writtenSpending that follows the law but is debated, with the numbers and the case on each side.
Where the numbers come from
On the data pages, figures are copied or summed from public federal datasets, then divided by population, GDP or a price index where a chart says so. Projections are marked as projections. The planning lab is a model, and the methods page explains how it is built and checked.
- Office of Management and Budget, Historical Tables
- Treasury, USAspending.gov and Fiscal Data
- Internal Revenue Service, Statistics of Income
- Social Security Administration, Office of the Chief Actuary
- Centers for Medicare and Medicaid Services
- Department of Veterans Affairs, Annual Benefits Report
- Department of Agriculture, Food and Nutrition Service
- PaymentAccuracy.gov and the Government Accountability Office
- Census Bureau population estimates
Fiscal Atlas is an independent Decisive Labs project. It is not affiliated with any government agency and does not give tax or financial advice.