AI Atlas
Charting the road to superintelligence
How long a task AI can complete, how it scores on the hardest tests, the chips and data centres behind it, the money and the people using it. Every chart is built on public data, refreshed once a day, with the source beside it and the trends carried forward.
Free in your browser. No account, nothing to install.
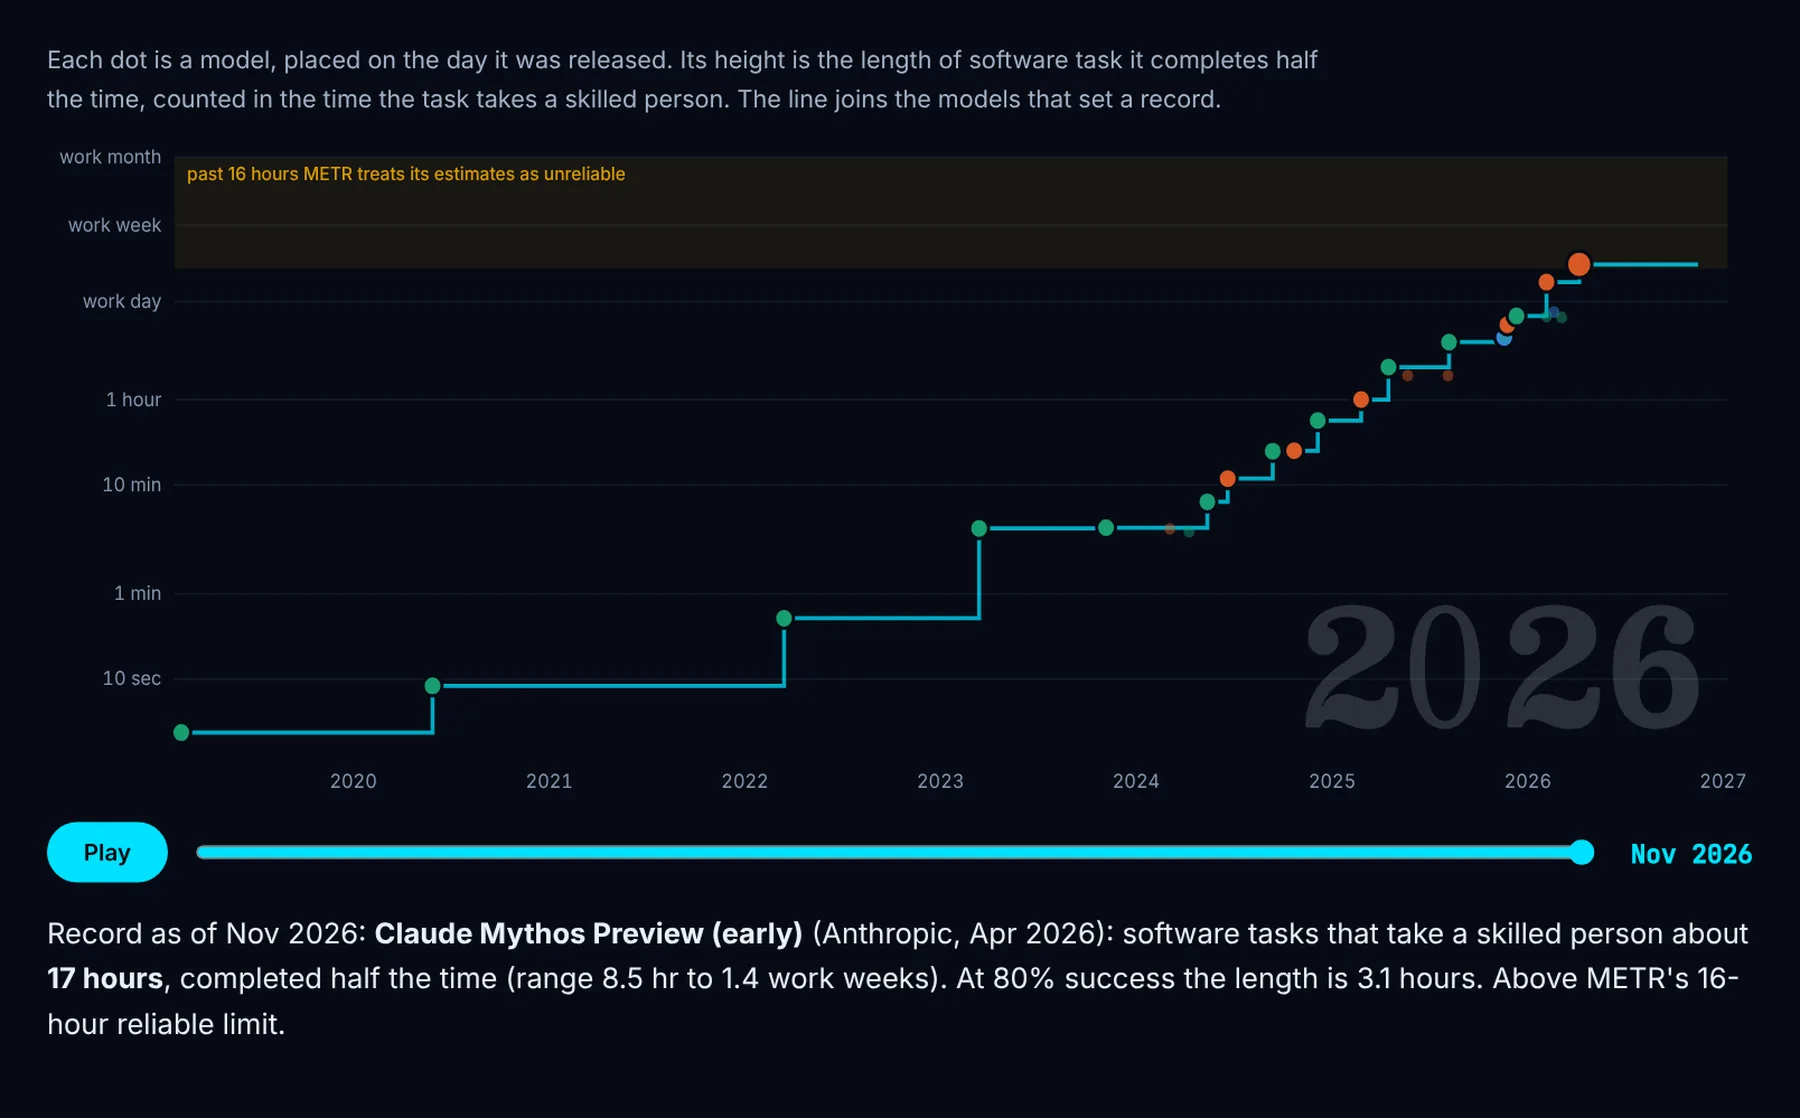
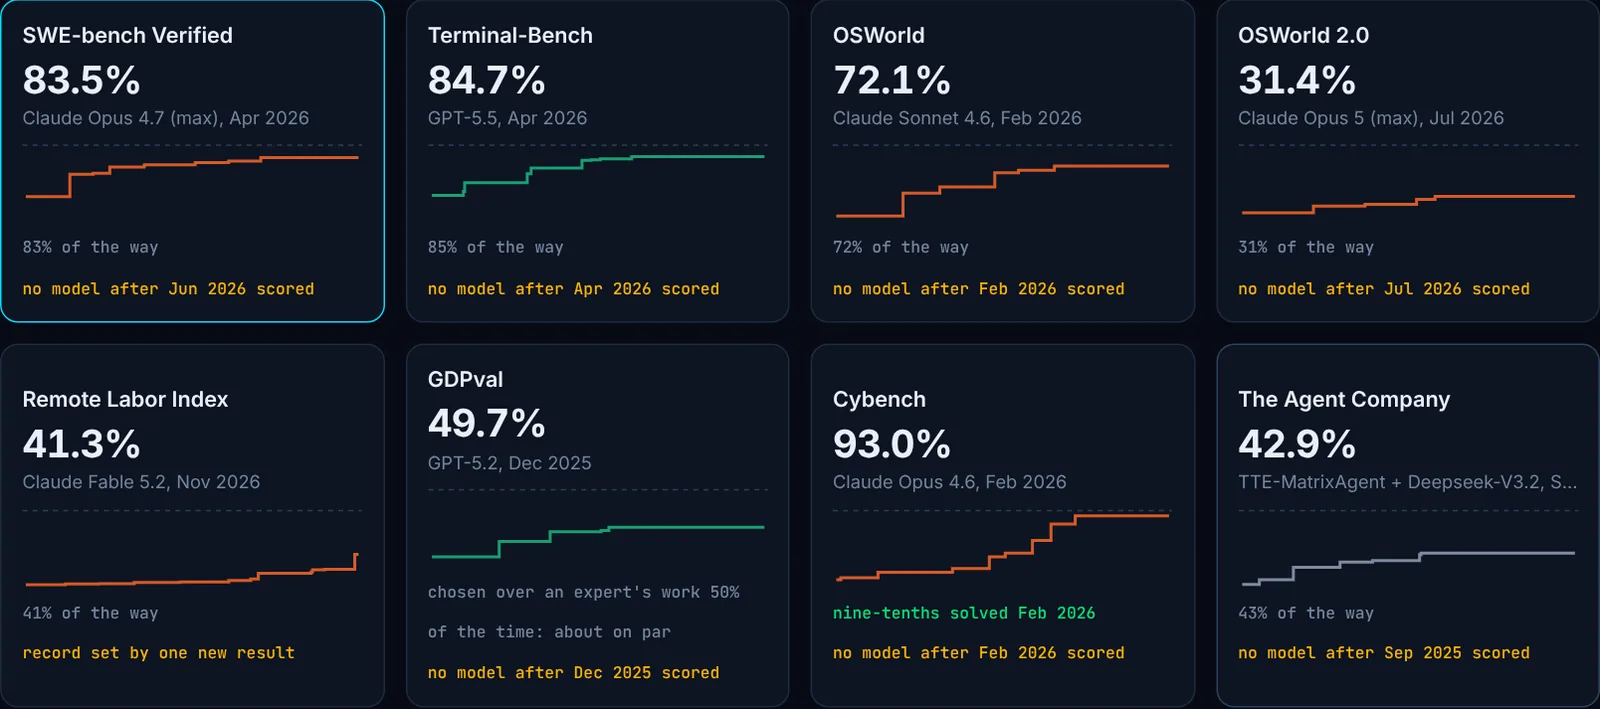
The length of task it can complete
An independent evaluator, METR, measures how long a job each model can complete, counted by how long the same job takes a skilled person. That length has been doubling every few months. The page says where the measure stops being reliable and what it does not cover.
Drag the doubling time and the chart shows when a work week, a work month and a work year would be reached. Projections are marked as projections.
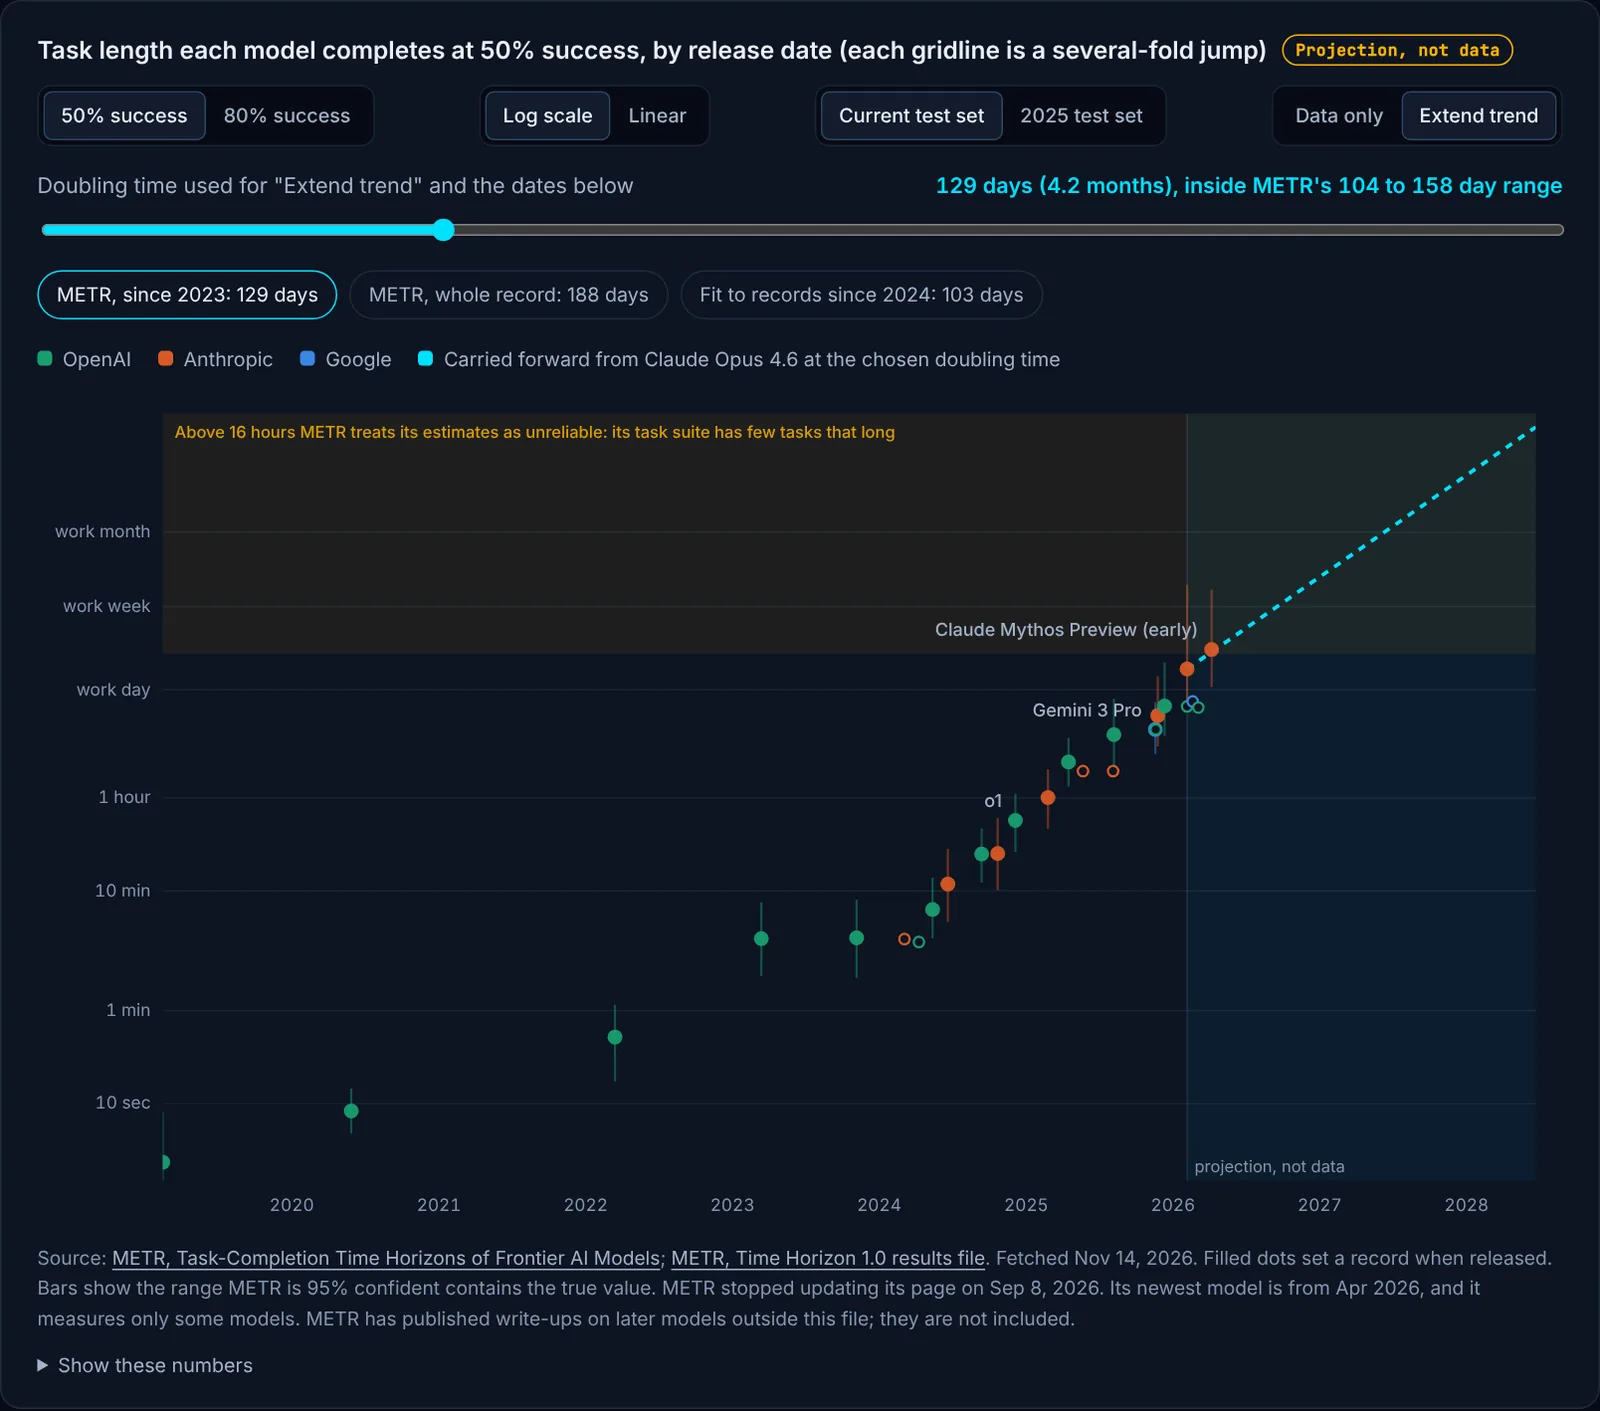
Where the data centres are
A map of the largest sites in the United States and worldwide, each drawn as a dome sized by its power. The solid dome is what is running; the dashed ring is the announced plan. Colour shows the lab using the site where that is confirmed.
Move the date from 2024 to 2030 to watch them fill in, zoom to a region, or pick a site for its build-out, users and cost.
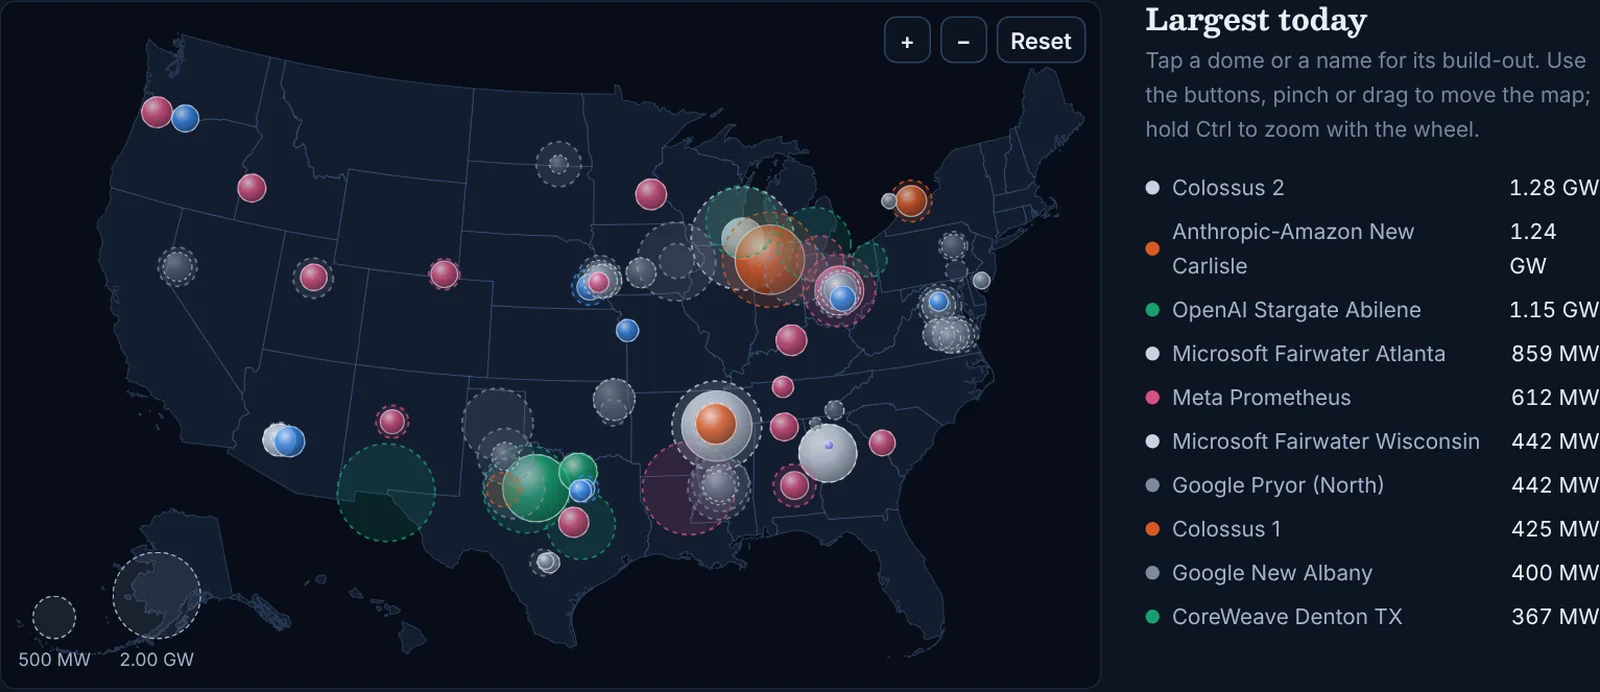
Tests, and how quickly they are solved
Nineteen benchmarks, from fixing real software bugs and finishing paid freelance work to research-level mathematics. Each card shows the best score so far; pick one to see every model that has taken it.
What each level of capability costs
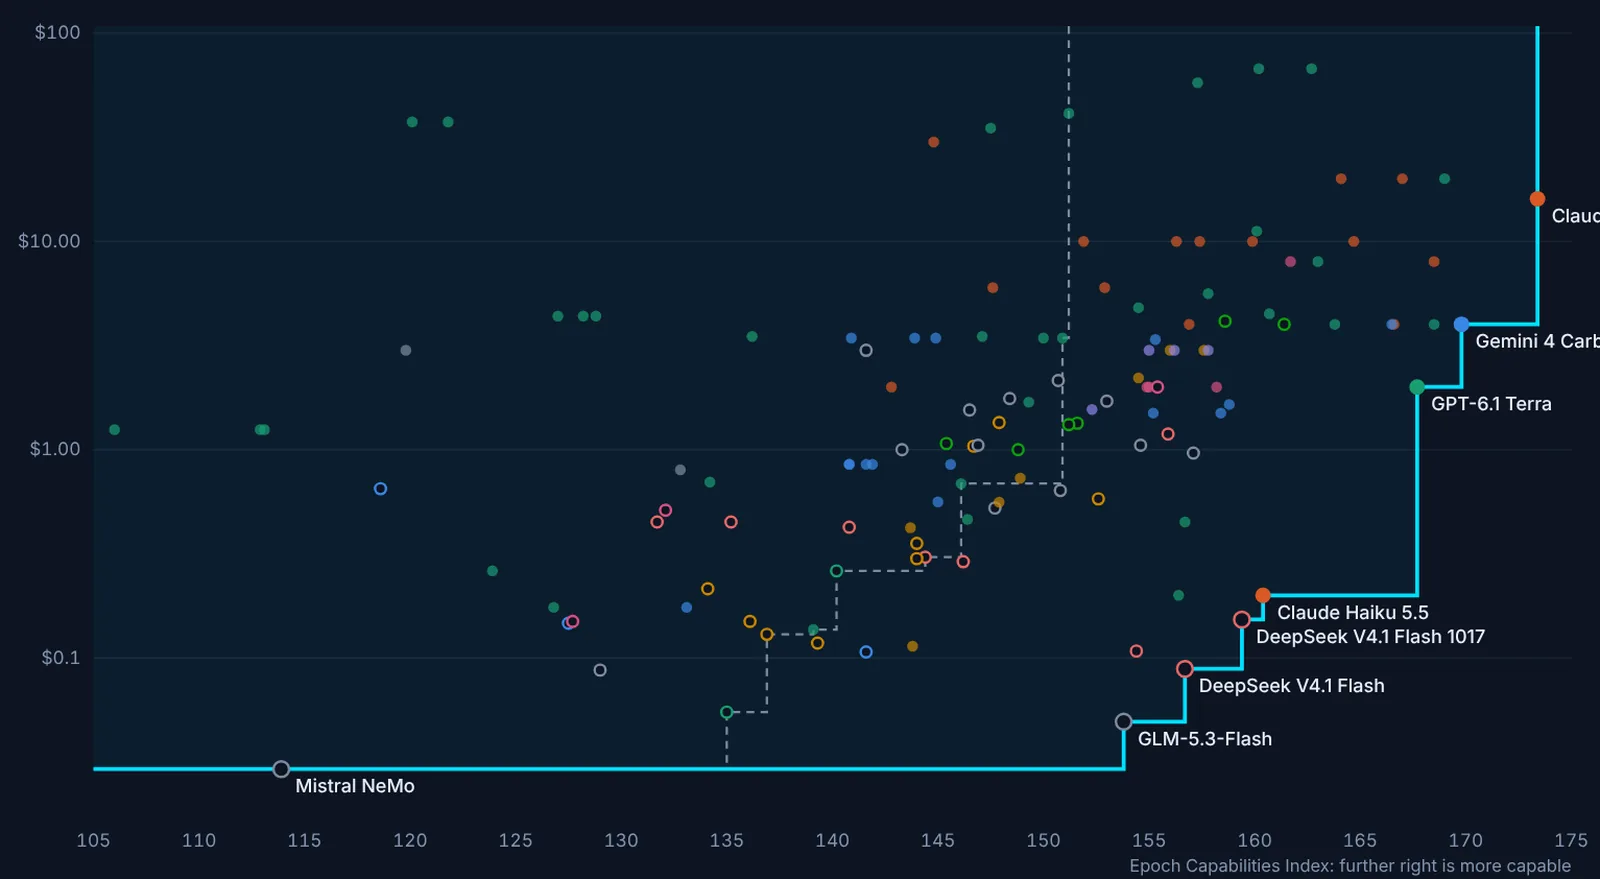
Every model plotted by capability against today's list price, with the frontier traced: the models nothing else beats on both. A second line shows the frontier of a year ago.
A companion chart follows how fast a fixed level of capability gets cheaper.
Measurement and projection are kept apart
Most arguments about where this is going mix what has been measured with what someone expects. AI Atlas separates them and shows its working.
- MeasuredFigures as their publishers report them: task lengths, test scores, chips shipped, revenue run rates, people using each assistant.
- Carried forwardEach trend extended as a fitted line, marked "Projection, not data", with every assumption listed on the page.
- What could bend itWhere the inputs could run short, where progress could speed up, and where today's tests stop being able to tell.
Where the numbers come from
A scheduled job downloads every source once a day and rebuilds the charts. If a source is down, its chapter keeps the last good copy and says so. Company revenue and usage figures are disclosures and press reports, not audited accounts.
- METR, task-completion time horizons
- Epoch AI, benchmarking hub and capabilities index
- Epoch AI, chip sales, lab compute and data centres
- Epoch AI, company revenue, funding and usage
- Anthropic Economic Index, job exposure
- Hugging Face Hub, open models
- Stanford AI Index, through Our World in Data
- U.S. Census Bureau and OpenStreetMap, for map positions
AI Atlas is an independent Decisive Labs project. It is not affiliated with any of the organisations whose data it uses, and its projections are not forecasts or investment advice.