Fiscal Atlas
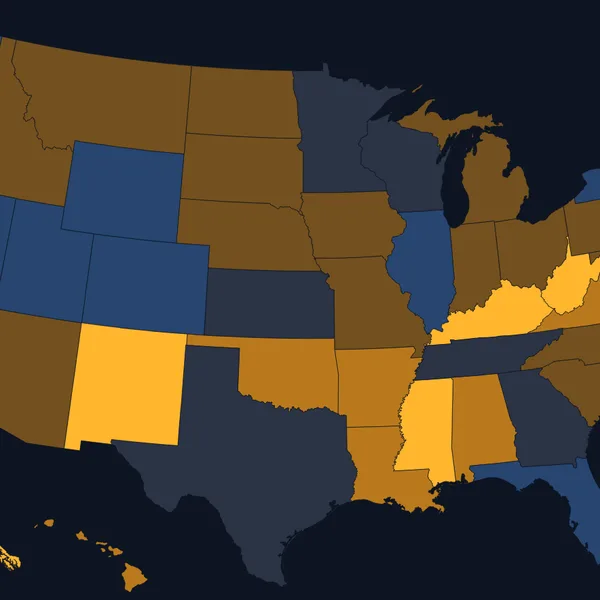
Where does a federal dollar go, and who paid for it?
Federal taxes, spending, benefits and debt since 1940, down to your county, with a receipt for your own taxes and policies you can try.
The atlases
The atlases are how I try to understand what is going on in the world. Each one takes a big question, pulls the public data behind it every day, and turns it into charts and maps you can move, with the source beside every one. They are free and they run in your browser.
Where does a federal dollar go, and who paid for it?
Federal taxes, spending, benefits and debt since 1940, down to your county, with a receipt for your own taxes and policies you can try.
Charting the road to superintelligence
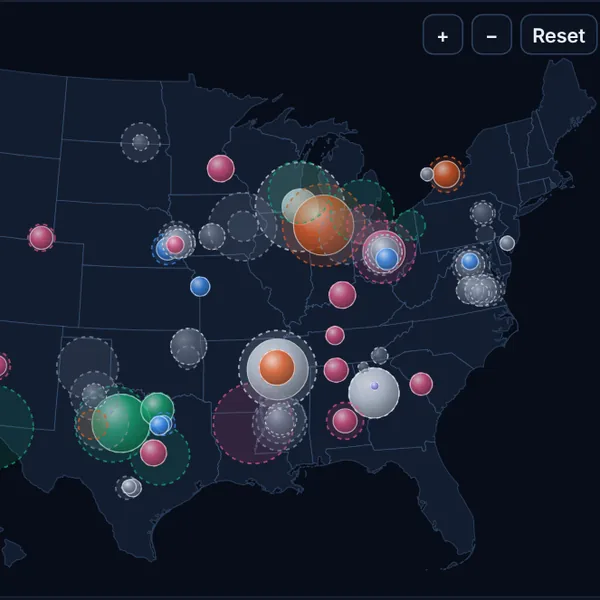
The length of task AI can finish alone, test scores, chips and data centres, money and adoption, with scenarios for what speeds the trend up or slows it down.
How long do we live, how well, and what could change it?
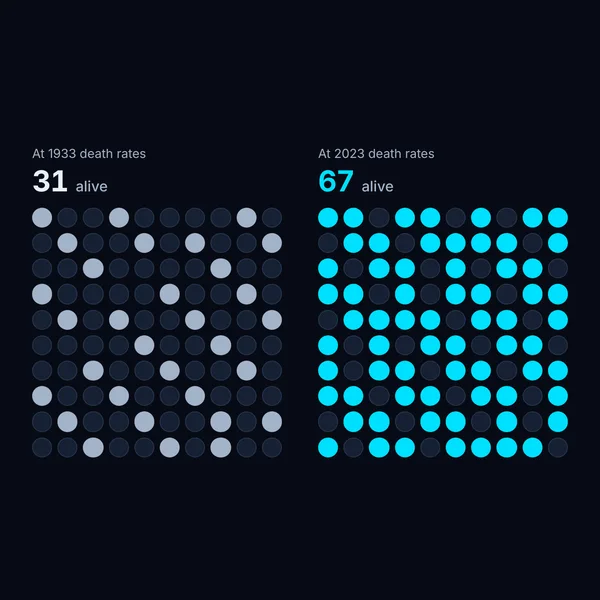
Life expectancy and healthy years, causes of death, the new weight-loss drugs, trials on ageing, and scenarios for what would bend the curve.
Where do machines already work without us, and how fast is that spreading?
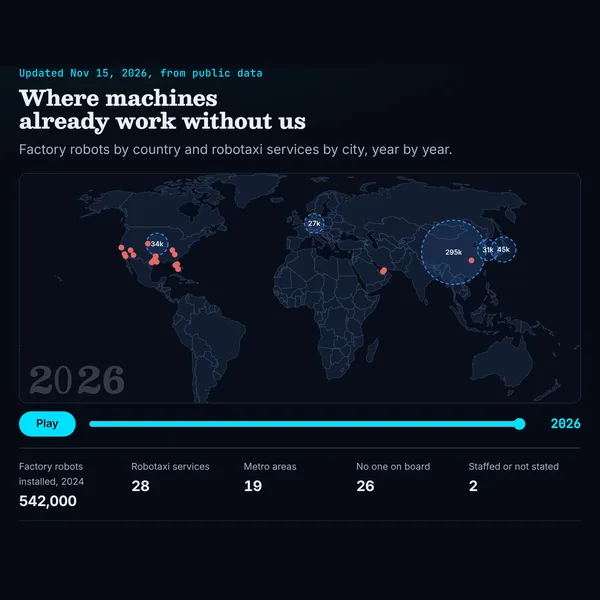
A count of every kind of robot at work, factory robots by country, humanoids by maker, and robotaxi fleets, rides and miles, on a map you can play through the years.
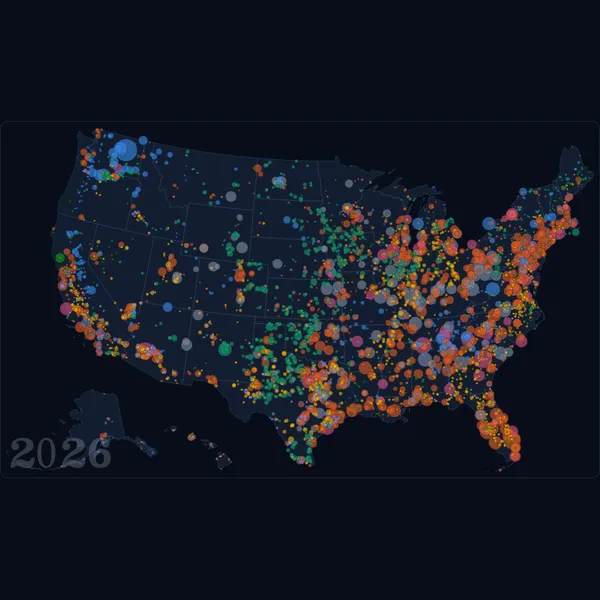
What powers the grid, and what is being built next?
Every large power plant in the United States on a map by the year it opened, what is planned and what is waiting for a connection, where the world gets its electricity, what solar and batteries cost, and the power AI data centres draw.
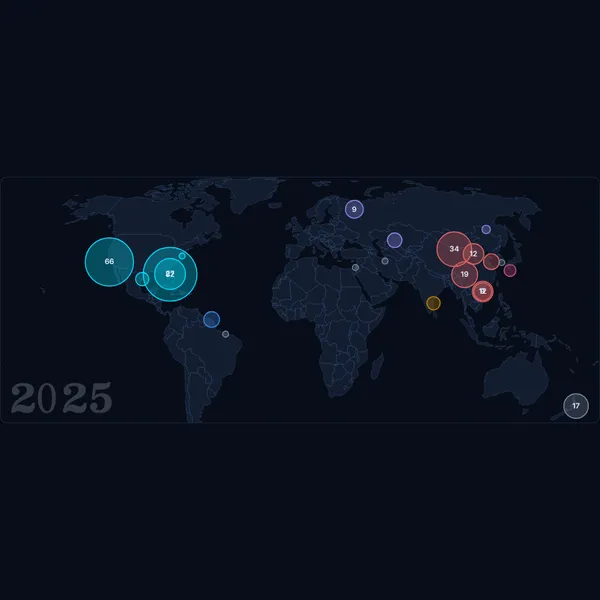
How often do rockets leave for orbit, and what is up there now?
Every launch to orbit since 1957 on a map of the launch sites, launches and tonnes by country, the rockets flying now, what a kilogram to orbit costs, and the satellites and debris in orbit today.
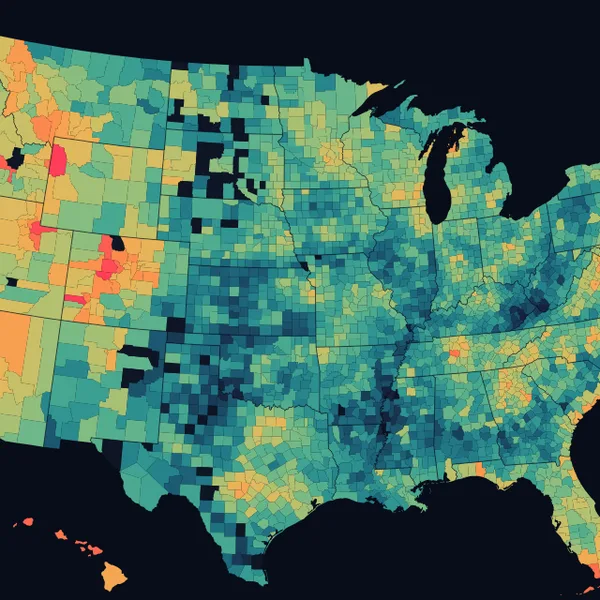
What does a home cost, and where is America building?
Home values in every county since 2000, the price of a new house against income, homes built and how long they take, what the land is worth from Manhattan to open country, and where people are moving.
Every atlas, every chapter and the tools beside them, as one map. Drag to turn it, select a node to fly there, and open it from the panel.
I spend a lot of time on X, more than I should. The feed keeps getting better at holding my attention, and what is in it keeps getting worse: more slop, and less of the discussion that made it worth reading.
What helps me is going to the data and the primary sources. That is hard to keep up. Everything is moving fast, the files are scattered across agencies and archives, and much of the analysis on podcasts and in the news comes with a political lean.
I am a visual learner, and I think most people are. Asking an AI chatbot a question helps, but the answer comes back as text, with nothing to look at.
So I built the atlases. Each one tells its story in figures, charts and maps. Having them side by side makes the connections easier to see: the power that AI data centres draw shows up in both the AI Atlas and the Energy Atlas. And each one updates itself as new information comes out, so the picture stays current without anyone rewriting it.
Each atlas compares its figures with the day before and lists what moved: a newer period from a source, or a revision to a figure already published. A refresh that finds nothing new adds nothing here.
We plan to add atlases as new questions come up. We also plan to build tools on top of them: projects that read the atlases' data files and put them to work on one question. Tesla Outlook is the first, a pilot for the kind of thing this could become.
The atlases are reference sites. Nothing on them is financial, medical or legal advice.