
A chart shows up in your feed claiming that some share of your taxes goes to one program, or that fraud costs the government an enormous sum every year. It might be right. It might also be off by a wide margin, or counting something different from what the caption says. Most people can't tell, and I don't blame them, because checking a federal budget number is a lot of work.
The data is public. It's also spread across the White House budget office's historical tables, Treasury's daily and monthly statements, USAspending, the IRS, the Census Bureau and the agencies' own reports, often with their own definitions and fiscal-year quirks. By the time you've found the right table and worked out what it counts, the conversation has usually moved on.
Fiscal Atlas is a new Decisive Labs site built to close that gap. It puts official U.S. government data in one place, with the source named under every chart, so you can answer the question yourself, usually in a few minutes. It doesn't tell you what to think about the answer. Here's what that looks like for three questions people tend to ask.
Where Your Tax Dollar Goes
The most personal question is where your own money went, and Fiscal Atlas answers it with a receipt. You type in what you paid in federal taxes last year, or let the site estimate it from your income, and it splits that amount the way federal spending was split, from Social Security and Medicare to defense and interest on the debt, with smaller programs like SNAP and foreign aid broken out for scale.
Then comes the line most receipts leave off. The government spends more than it collects, so the receipt adds your share of the borrowing on top of what you paid. I think that one line does more to make the deficit concrete than any chart of trillions, because it's sized to you. The site is careful to call the receipt an illustration, since tax dollars aren't earmarked (payroll taxes are the exception, funding Social Security and Medicare by law). It also says that nothing you type leaves the page.
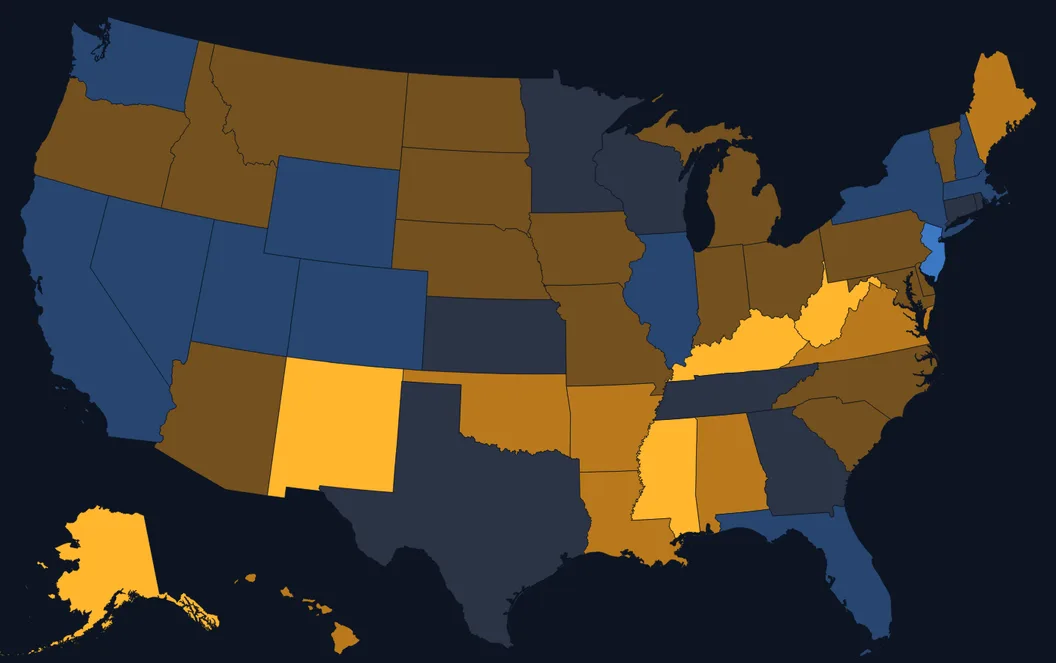
From there, the map shows where federal money lands. Pick your state to see its counties, then switch between measures such as federal dollars received per dollar of income tax paid, or Social Security, SNAP and veterans benefits per resident. The page explains how to read it. Income tax is only part of federal revenue, so the map compares places with each other rather than giving a full account of what any state pays in and gets back.
Checking a Viral Number
Claims about waste and fraud are where I think a reference site earns its keep, because they usually blend three different things. Fiscal Atlas keeps them apart.
- Paid in error. Payments agencies themselves measure as wrong or unverifiable. That includes underpayments and missing paperwork, so most of it isn't theft.
- Stolen. Fraud, which the Government Accountability Office estimates as a government-wide range. GAO says its estimate isn't a forecast and can't be applied to any single program.
- Working as written. Payments that follow the law but that many people think the law shouldn't allow. No audit flags them, because nothing went wrong.
So when a post puts one big number on "waste," you can see which of the three it's describing, find the official figure for that bucket, and read the agency's own caveats next to it. For the third bucket, where the disagreement is about policy and not accounting, the site puts the case for change and the case against side by side, on questions like veterans rated for minor conditions, relatives paid as Medicaid caregivers, and federal money for college. It doesn't pick a winner.
Every figure along the way can be traced. Each chart names its source and opens into a table of the numbers with a CSV download, and its copy-link button gives you a link that opens the page at that chart. The Sources section lists every dataset with the date it was retrieved. For a debate that usually runs on screenshots, I think that's the most useful thing the site does.
Trying a Fix Yourself
The harder question comes after the facts: what it would take to change the trend, and who would feel it. That's what the policy lab is for. It's a separate page, kept apart from the official data, because it's a model.
You can begin from the current path or one of three starting plans, or switch on an assumption of faster growth, which the site marks as not a policy. The productivity lever is labelled the same way, since no bill sets productivity. You can also set the levers yourself, on growth, Social Security and health, plus taxes and other spending. The model reruns three decades of the budget as you drag. Two things make it more than a calculator. Each lever lists who has proposed it, tied to a bill, a budget or a public statement and labelled by party or as outside the parties, with the opposing side shown where there is one. And for any change, the lab shows how many people are in the affected programs and which states have the most at stake.
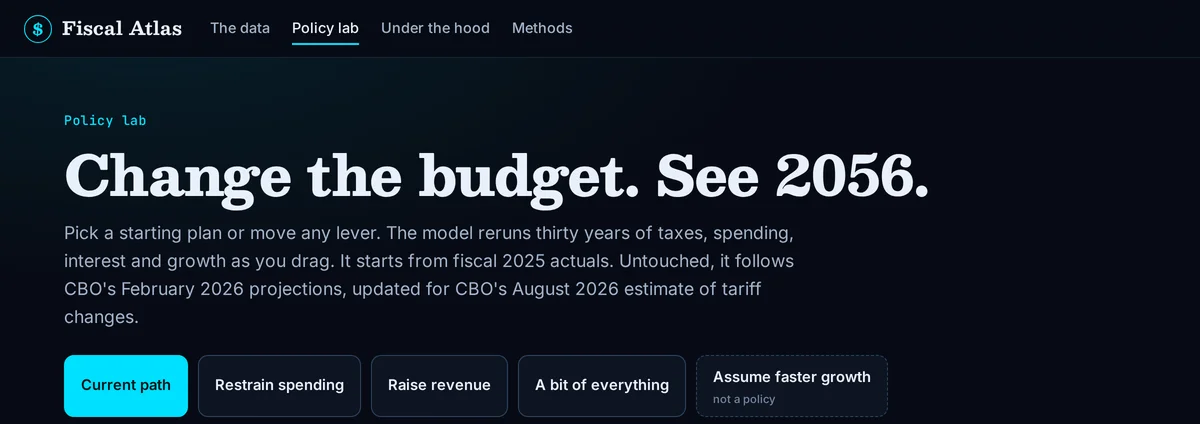
I'd read the results the way the site asks you to. With nothing moved, the model is set to follow the Congressional Budget Office's projections under current law, and the methods page tests the levers against CBO's published ten-year scores where CBO has one. The same page says plainly that the model was adjusted until it passed, that agreeing with CBO doesn't make either one right, and that nobody outside the project has reviewed it. Past the first decade, the results are illustrations. That seems like the right level of confidence for a tool like this, and it's printed where you can see it.
Once you've built a plan, you can copy a link to it and send it to someone. I think that beats arguing in the abstract.
Try It on the Next Number You See
Fiscal Atlas is live at decisivelabsllc.com/atlas, and it works on a phone. My suggestion is to wait for the next budget number that crosses your feed, then open the site and see whether you can find it. Start with the receipt using your own taxes, then follow the source under whichever chart answers your question. The methods page explains how every figure is built. If a number looks wrong, or there's a source you think the site should use, I'd like to hear about it at contact@decisivelabsllc.com.
Fiscal Atlas is independent and isn't affiliated with any government agency. It takes no position on what the numbers mean for policy. That part is up to you.
See where the money goes
Official U.S. government data, with the source under every chart. Check the next number yourself.